Interquartile Range | Understand, Calculate & Visualize IQR
In descriptive statistics, the interquartile range tells you the spread of the middle half of your distribution.
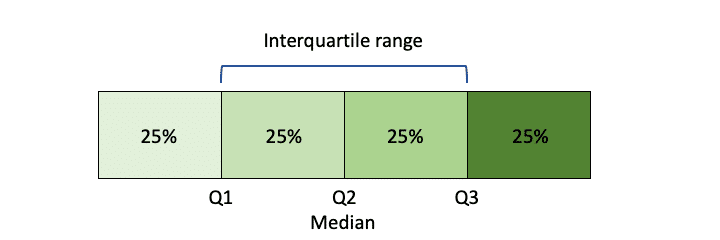
Quartiles segment any distribution that’s ordered from low to high into four equal parts. The interquartile range (IQR) contains the second and third quartiles, or the middle half of your data set.
Whereas the range gives you the spread of the whole data set, the interquartile range gives you the range of the middle half of a data set.
Calculate the interquartile range
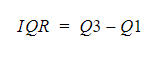
The interquartile range is found by subtracting the Q1 value from the Q3 value:
| Formula | Explanation |
|---|---|
 |
|
Q1 is the value below which 25 percent of the distribution lies, while Q3 is the value below which 75 percent of the distribution lies.
You can think of Q1 as the median of the first half and Q3 as the median of the second half of the distribution.
Methods for finding the interquartile range
Although there’s only one formula, there are various different methods for identifying the quartiles. You’ll get a different value for the interquartile range depending on the method you use.
Here, we’ll discuss two of the most commonly used methods. These methods differ based on how they use the median.
Exclusive method vs inclusive method
The exclusive method excludes the median when identifying Q1 and Q3, while the inclusive method includes the median in identifying the quartiles.
The procedure for finding the median is different depending on whether your data set is odd- or even-numbered.
- When you have an odd number of data points, the median is the value in the middle of your data set. You can choose between the inclusive and exclusive method.
- With an even number of data points, there are two values in the middle, so the median is their mean. It’s more common to use the exclusive method in this case.
While there is little consensus on the best method for finding the interquartile range, the exclusive interquartile range is always larger than the inclusive interquartile range.
The exclusive interquartile range may be more appropriate for large samples, while for small samples, the inclusive interquartile range may be more representative because it’s a narrower range.
Steps for the exclusive method
To see how the exclusive method works by hand, we’ll use two examples: one with an even number of data points, and one with an odd number.
Even-numbered data set
We’ll walk through four steps using a sample data set with 10 values.
| Step 1: Order your values from low to high. |
|---|
 |
| Step 2: Locate the median, and then separate the values below it from the values above it. |
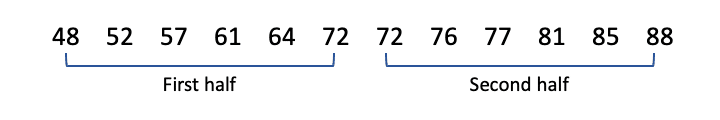
With an even-numbered data set, the median is the mean of the two values in the middle, so you simply divide your data set into two halves.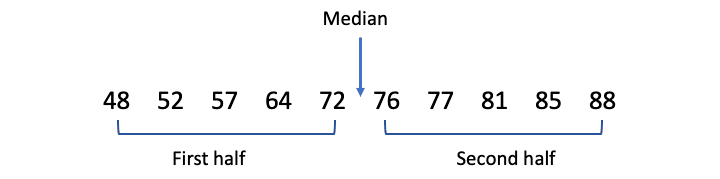 |
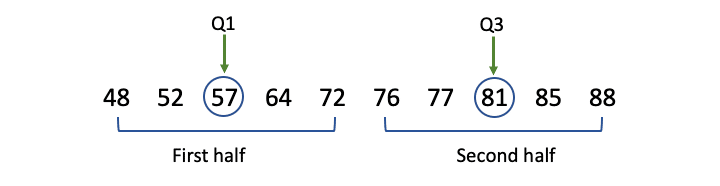
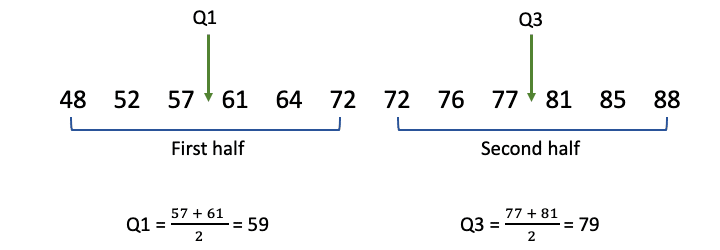
| Step 3: Find Q1 and Q3. |
| Q1 is the median of the first half and Q3 is the median of the second half. Since each of these halves have an odd number of values, there is only one value in the middle of each half.
|
| Step 4: Calculate the interquartile range. |
 |
Odd-numbered data set
This time we’ll use a data set with 11 values.
| Step 1: Order your values from low to high. |
|---|
 |
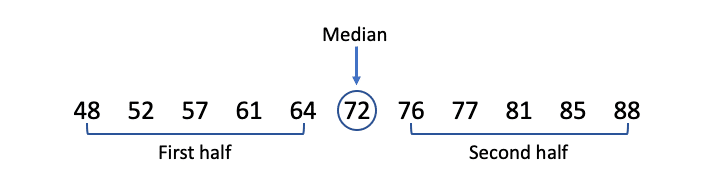
| Step 2: Locate the median, and then separate the values below it from the values above it. |
| In an odd-numbered data set, the median is the number in the middle of the list. The median itself is excluded from both halves: one half contains all values below the median, and the other contains all the values above it.
|
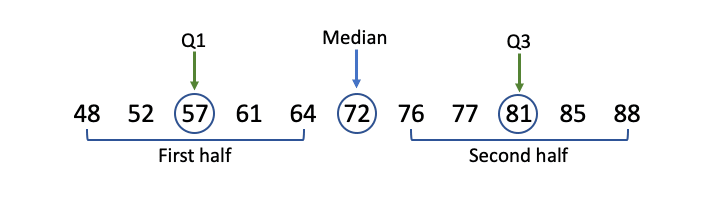
| Step 3: Find Q1 and Q3. |
| Q1 is the median of the first half and Q3 is the median of the second half. Since each of these halves have an odd-numbered size, there is only one value in the middle of each half.
|
| Step 4: Calculate the interquartile range. |
|
Steps for the inclusive method
Almost all of the steps for the inclusive and exclusive method are identical. The difference is in how the data set is separated into two halves.
The inclusive method is sometimes preferred for odd-numbered data sets because it doesn’t ignore the median, a real value in this type of data set.
| Step 1: Order your values from low to high. |
|---|
|
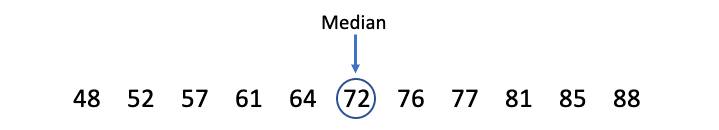
| Step 2: Find the median. |
| The median is the number in the middle of the data set.
|
| Step 2: Separate the list into two halves, and include the median in both halves. |
| The median is included as the highest value in the first half and the lowest value in the second half.
|
| Step 3: Find Q1 and Q3. |
| Q1 is the median of the first half and Q3 is the median of the second half. Since the two halves each contain an even number of values, Q1 and Q3 are calculated as the means of the middle values.
|
| Step 4: Calculate the interquartile range. |
 |
We can see from these examples that using the inclusive method gives us a smaller IQR. With the same data set, the exclusive IQR is 24, and the inclusive IQR is 20.
When is the interquartile range useful?
The interquartile range is an especially useful measure of variability for skewed distributions.
For these distributions, the median is the best measure of central tendency because it’s the value exactly in the middle when all values are ordered from low to high.
Along with the median, the IQR can give you an overview of where most of your values lie and how clustered they are.
The IQR is also useful for datasets with outliers. Because it’s based on the middle half of the distribution, it’s less influenced by extreme values.
Visualize the interquartile range in boxplots
A boxplot, or a box-and-whisker plot, summarizes a data set visually using a five-number summary.
Every distribution can be organized using these five numbers:
- Lowest value
- Q1: 25th percentile
- Median
- Q3: 75th percentile
- Highest value (Q4)
The vertical lines in the box show Q1, the median, and Q3, while the whiskers at the ends show the highest and lowest values.
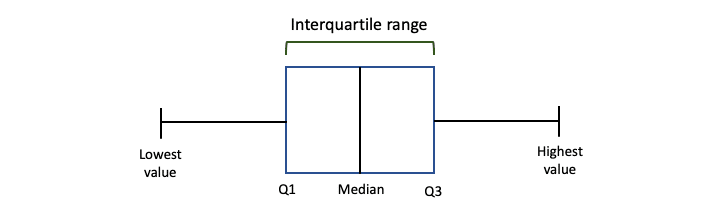
In a boxplot, the width of the box shows you the interquartile range. A smaller width means you have less dispersion, while a larger width means you have more dispersion.
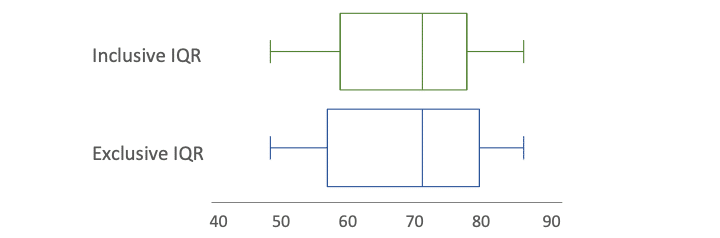
An inclusive interquartile range will have a smaller width than an exclusive interquartile range.
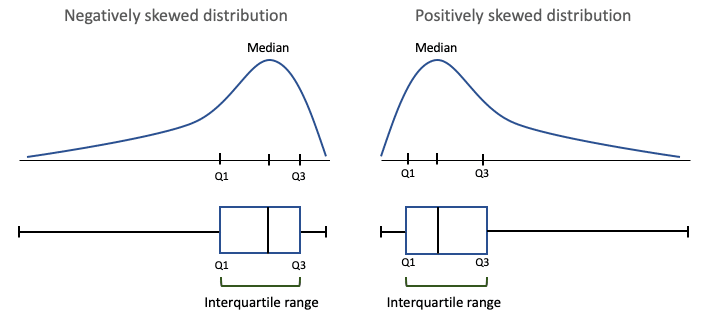
Boxplots are especially useful for showing the central tendency and dispersion of skewed distributions.
The placement of the box tells you the direction of the skew. A box that’s much closer to the right side means you have a negatively skewed distribution, and a box closer to the left side tells you that you have a positively skewed distribution.
Frequently asked questions about the interquartile range
- What are the 4 main measures of variability?
-
Variability is most commonly measured with the following descriptive statistics:
- Range: the difference between the highest and lowest values
- Interquartile range: the range of the middle half of a distribution
- Standard deviation: average distance from the mean
- Variance: average of squared distances from the mean
- What’s the difference between the range and interquartile range?
-
While the range gives you the spread of the whole data set, the interquartile range gives you the spread of the middle half of a data set.
- When should I use the interquartile range?
-
The interquartile range is the best measure of variability for skewed distributions or data sets with outliers. Because it’s based on values that come from the middle half of the distribution, it’s unlikely to be influenced by outliers.
- What are the two main methods for calculating interquartile range?
-
The two most common methods for calculating interquartile range are the exclusive and inclusive methods.
The exclusive method excludes the median when identifying Q1 and Q3, while the inclusive method includes the median as a value in the data set in identifying the quartiles.
For each of these methods, you’ll need different procedures for finding the median, Q1 and Q3 depending on whether your sample size is even- or odd-numbered. The exclusive method works best for even-numbered sample sizes, while the inclusive method is often used with odd-numbered sample sizes.
Sources in this article
We strongly encourage students to use sources in their work. You can cite our article (APA Style) or take a deep dive into the articles below.
This Scribbr articleBhandari, P. (May 20, 2022). Interquartile Range | Understand, Calculate & Visualize IQR. Scribbr. Retrieved October 19, 2022, from https://www.scribbr.com/statistics/interquartile-range/