T-Distribution | What It Is and How To Use It (With Examples)
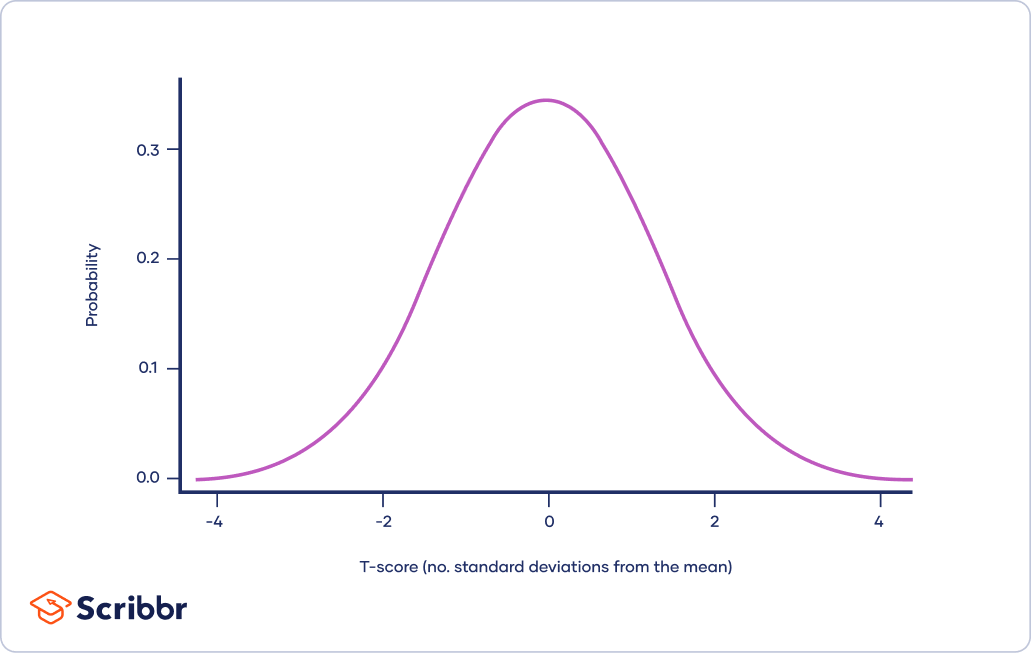
The t-distribution, also known as Student’s t-distribution, is a way of describing data that follow a bell curve when plotted on a graph, with the greatest number of observations close to the mean and fewer observations in the tails.
It is a type of normal distribution used for smaller sample sizes, where the variance in the data is unknown.
In statistics, the t-distribution is most often used to:
- Find the critical values for a confidence interval when the data is approximately normally distributed.
- Find the corresponding p-value from a statistical test that uses the t-distribution (t-tests, regression analysis).
What is a t-distribution?
The t-distribution is a type of normal distribution that is used for smaller sample sizes. Normally-distributed data form a bell shape when plotted on a graph, with more observations near the mean and fewer observations in the tails.
The t-distribution is used when data are approximately normally distributed, which means the data follow a bell shape but the population variance is unknown. The variance in a t-distribution is estimated based on the degrees of freedom of the data set (total number of observations minus 1).
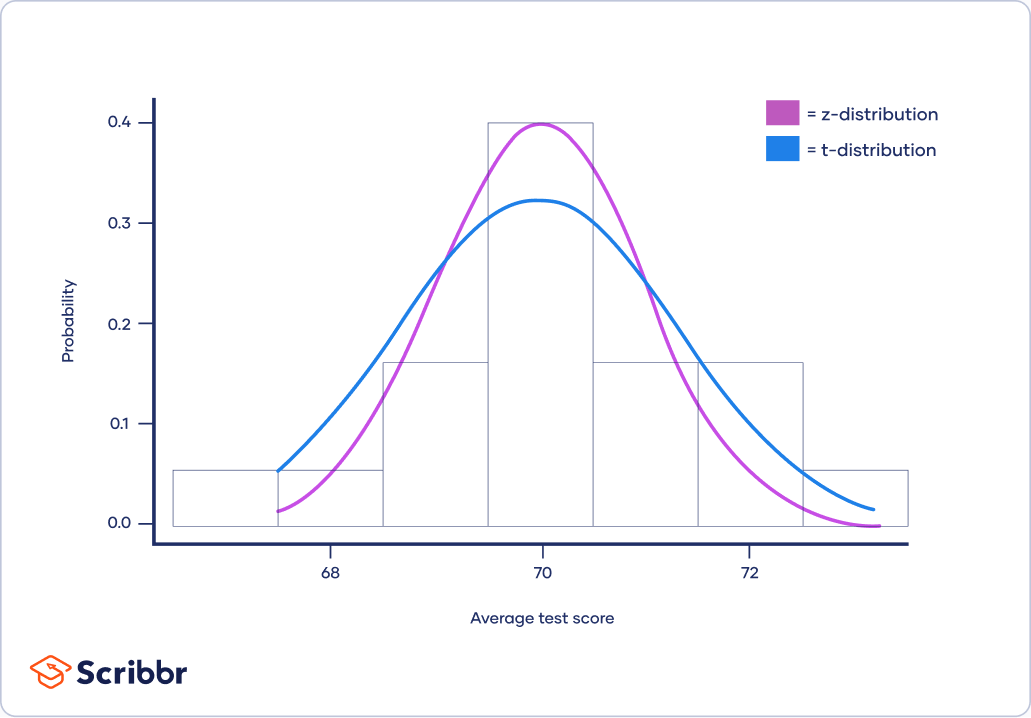
It is a more conservative form of the standard normal distribution, also known as the z-distribution. This means that it gives a lower probability to the center and a higher probability to the tails than the standard normal distribution.
T-distribution and the standard normal distribution
As the degrees of freedom (total number of observations minus 1) increases, the t-distribution will get closer and closer to matching the standard normal distribution, a.k.a. the z-distribution, until they are almost identical.
Above 30 degrees of freedom, the t-distribution roughly matches the z-distribution. Therefore, the z-distribution can be used in place of the t-distribution with large sample sizes.
The z-distribution is preferable over the t-distribution when it comes to making statistical estimates because it has a known variance. It can make more precise estimates than the t-distribution, whose variance is approximated using the degrees of freedom of the data.

T-distribution and t-scores
A t-score is the number of standard deviations from the mean in a t-distribution. You can typically look up a t-score in a t-table, or by using an online t-score calculator.
In statistics, t-scores are primarily used to find two things:
- The upper and lower bounds of a confidence interval when the data are approximately normally distributed.
- The p-value of the test statistic for t-tests and regression tests.
T-scores and confidence intervals
Confidence intervals use t-scores to calculate the upper and lower bounds of the prediction interval. The t-score used to generate the upper and lower bounds is also known as the critical value of t, or t*.
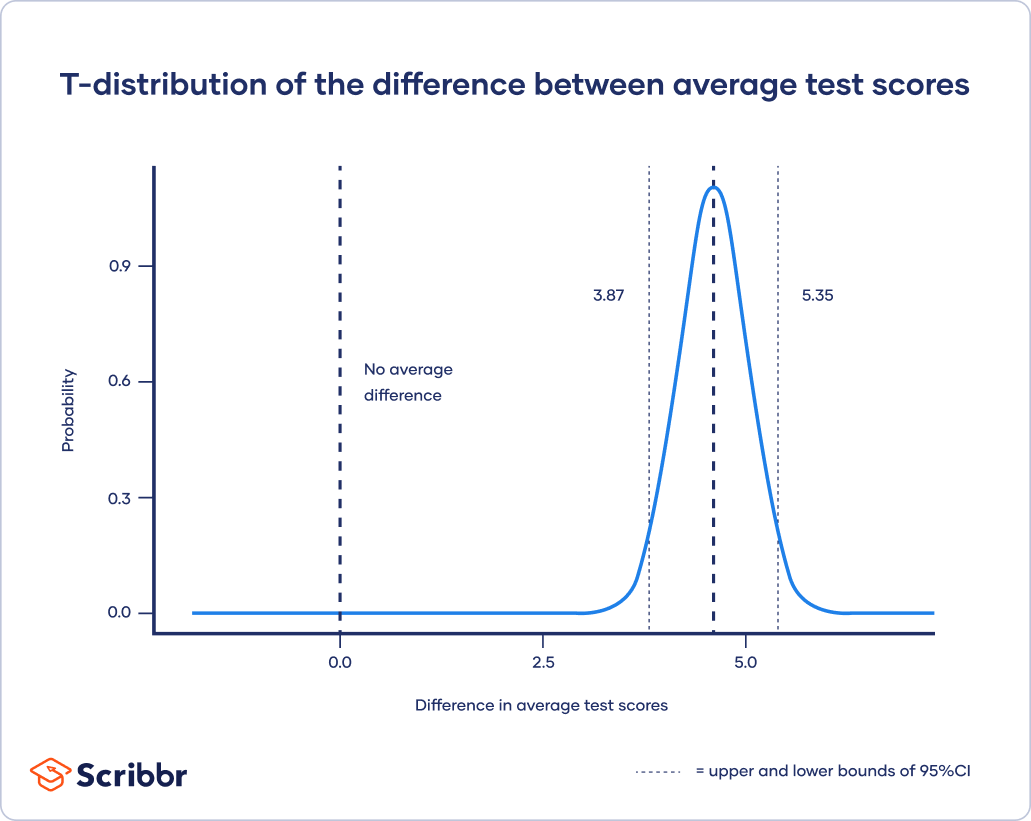
Using a two-tailed t-test, you generate an estimate of the difference between the two classes and a confidence interval around that estimate. From the t-test you find the difference in average score between class 1 and class 2 is 4.61, with a 95% confidence interval of 3.87 to 5.35.
Because the confidence interval does not cross zero, and is in fact quite far from zero, it is unlikely that this difference in test scores could have occurred under the null hypothesis of no difference between groups.
T-scores and p-values
Statistical tests generate a test statistic showing how far from the null hypothesis of the statistical test your data is. They then calculate a p-value that describes the likelihood of your data occurring if the null hypothesis were true.
The test statistic for t-tests and regression tests is the t-score. While most statistical programs will automatically calculate the corresponding p-value for the t-score, you can also look up the values in a t-table, using your degrees of freedom and t-score to find the p-value.
The t-score which generates a p-value below your threshold for statistical significance is known as the critical value of t, or t*.
The degrees of freedom is 38 (n–1 for each group). Looking this up in a t-table (or calculating it in your favorite stats program) you find a p-value < 0.001.
This finding, like the finding from the confidence interval, suggests that you are not likely to find a difference this large if the true difference in average test scores is zero.
Frequently asked questions about the t-distribution
- What is a t-distribution?
-
The t-distribution is a way of describing a set of observations where most observations fall close to the mean, and the rest of the observations make up the tails on either side. It is a type of normal distribution used for smaller sample sizes, where the variance in the data is unknown.
The t-distribution forms a bell curve when plotted on a graph. It can be described mathematically using the mean and the standard deviation.
- What is the difference between the t-distribution and the standard normal distribution?
-
The t-distribution gives more probability to observations in the tails of the distribution than the standard normal distribution (a.k.a. the z-distribution).
In this way, the t-distribution is more conservative than the standard normal distribution: to reach the same level of confidence or statistical significance, you will need to include a wider range of the data.
- What is a t-score?
-
A t-score (a.k.a. a t-value) is equivalent to the number of standard deviations away from the mean of the t-distribution.
The t-score is the test statistic used in t-tests and regression tests. It can also be used to describe how far from the mean an observation is when the data follow a t-distribution.
- What is a test statistic?
-
A test statistic is a number calculated by a statistical test. It describes how far your observed data is from the null hypothesis of no relationship between variables or no difference among sample groups.
The test statistic tells you how different two or more groups are from the overall population mean, or how different a linear slope is from the slope predicted by a null hypothesis. Different test statistics are used in different statistical tests.
- What is a critical value?
-
A critical value is the value of the test statistic which defines the upper and lower bounds of a confidence interval, or which defines the threshold of statistical significance in a statistical test. It describes how far from the mean of the distribution you have to go to cover a certain amount of the total variation in the data (i.e. 90%, 95%, 99%).
If you are constructing a 95% confidence interval and are using a threshold of statistical significance of p = 0.05, then your critical value will be identical in both cases.
Sources in this article
We strongly encourage students to use sources in their work. You can cite our article (APA Style) or take a deep dive into the articles below.
This Scribbr articleBevans, R. (July 9, 2022). T-Distribution | What It Is and How To Use It (With Examples). Scribbr. Retrieved October 17, 2022, from https://www.scribbr.com/statistics/t-distribution/
