Student's t Table (Free Download) | Guide & Examples
Student’s t table is a reference table that lists critical values of t. Student’s t table is also known as the t table, t-distribution table, t-score table, t-value table, or t-test table.
A critical value of t defines the threshold for significance for certain statistical tests and the upper and lower bounds of confidence intervals for certain estimates. It is most commonly used when:
- Testing whether two means are significantly different (two-sample t tests)
- Testing whether two variables are significantly related (linear regression or correlation)
- Calculating confidence intervals (of means or regression coefficients)
The critical values of t are calculated from Student’s t distribution. Student’s t distribution is the distribution of the test statistic t. The critical values of t are difficult to calculate by hand, which is why most people use a t table or computer software instead.
Student’s t table for one- and two-tailed tests
Use the tables below to find the critical values of t or learn how to use the t table
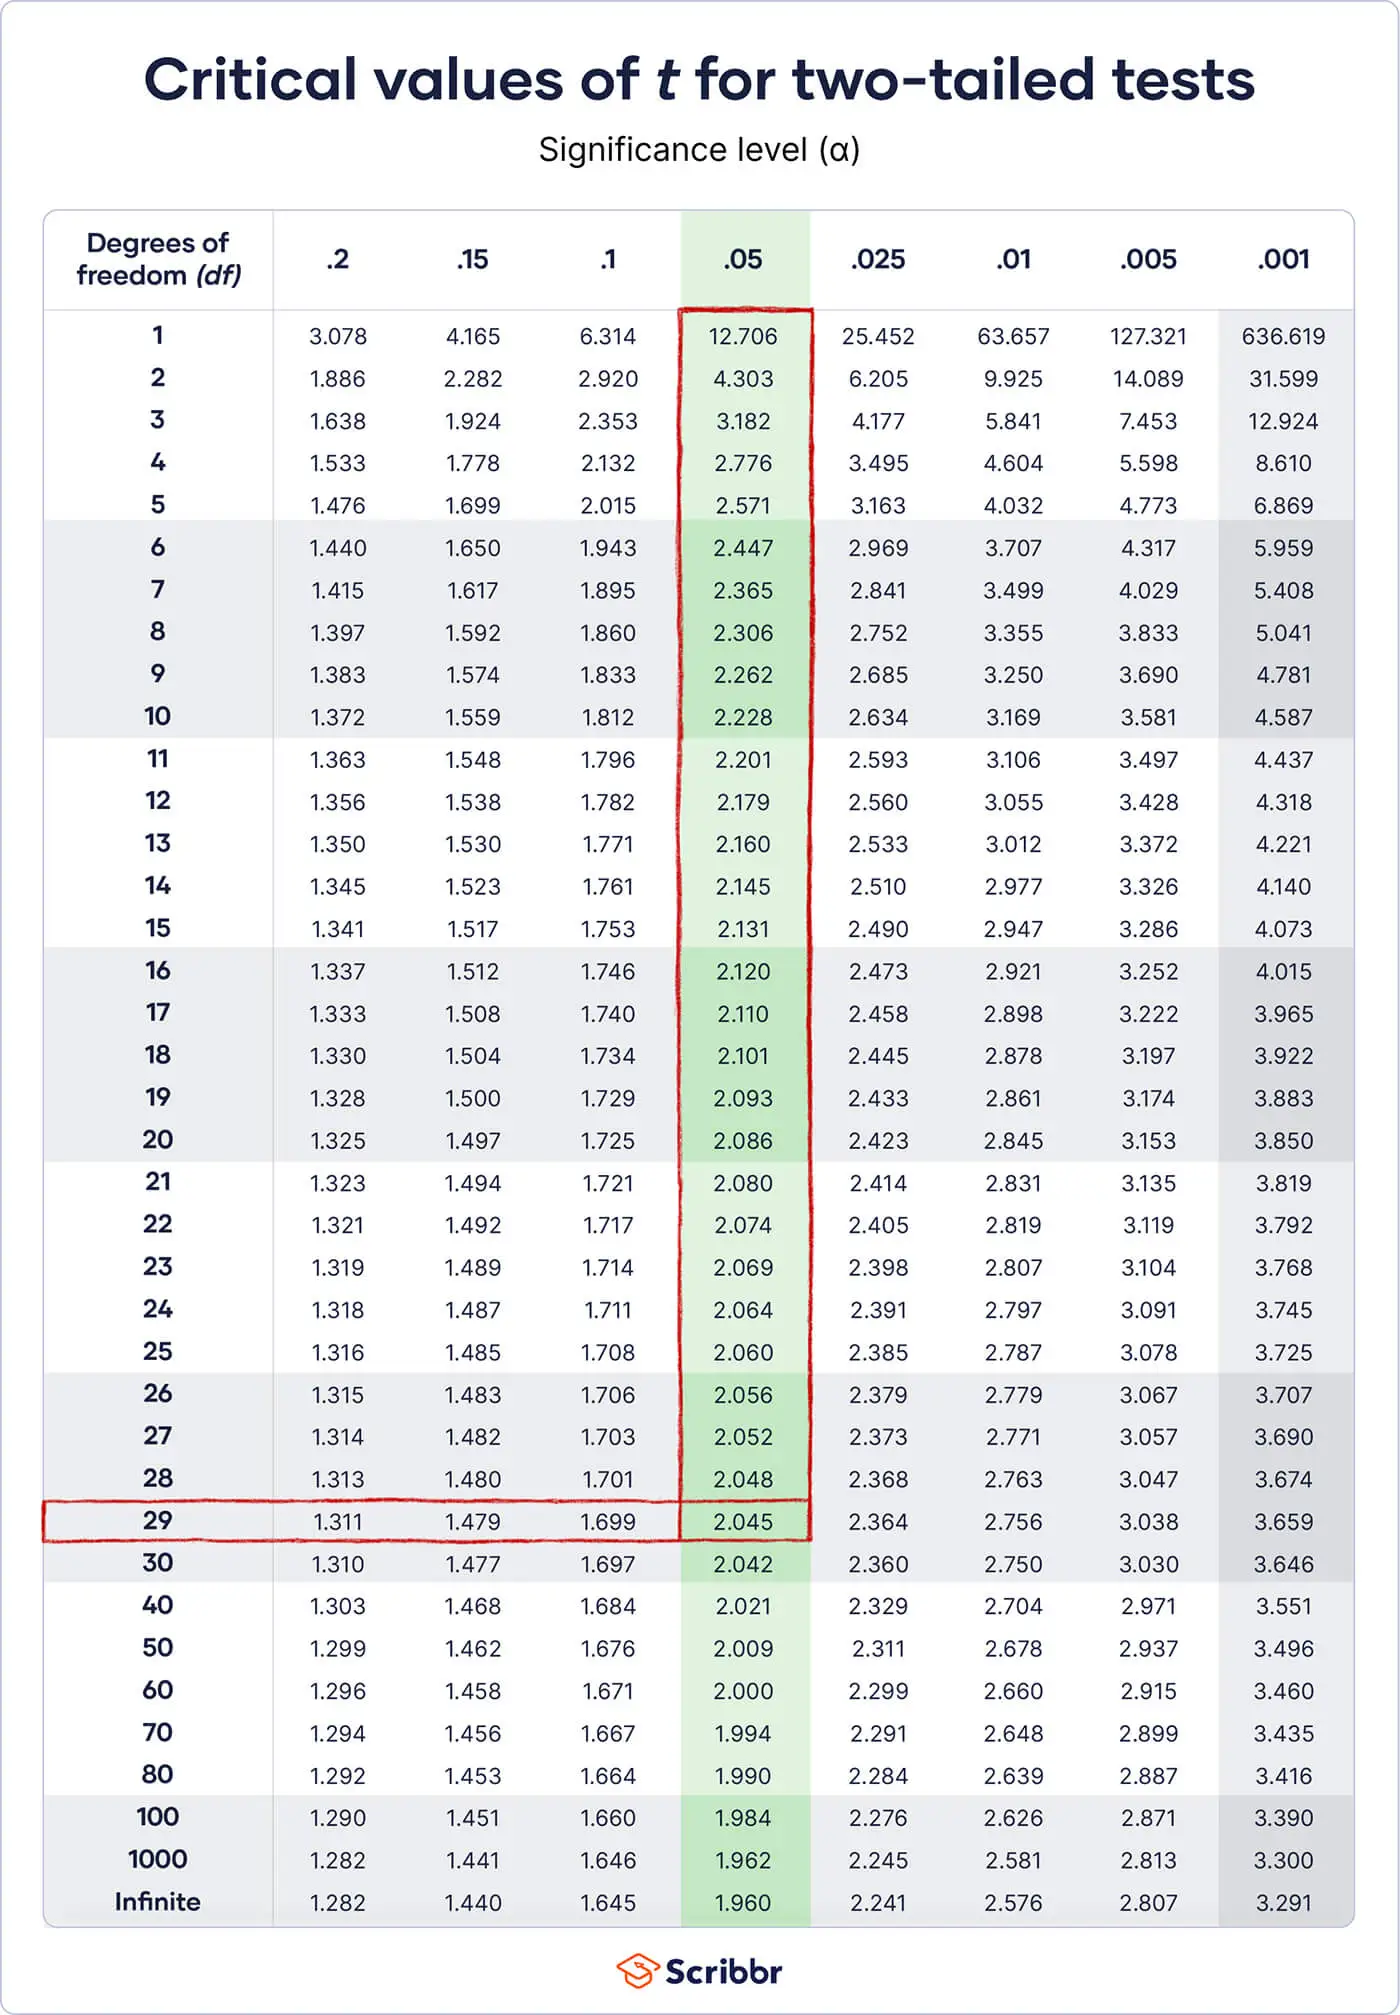
- Critical values of t for two-tailed tests
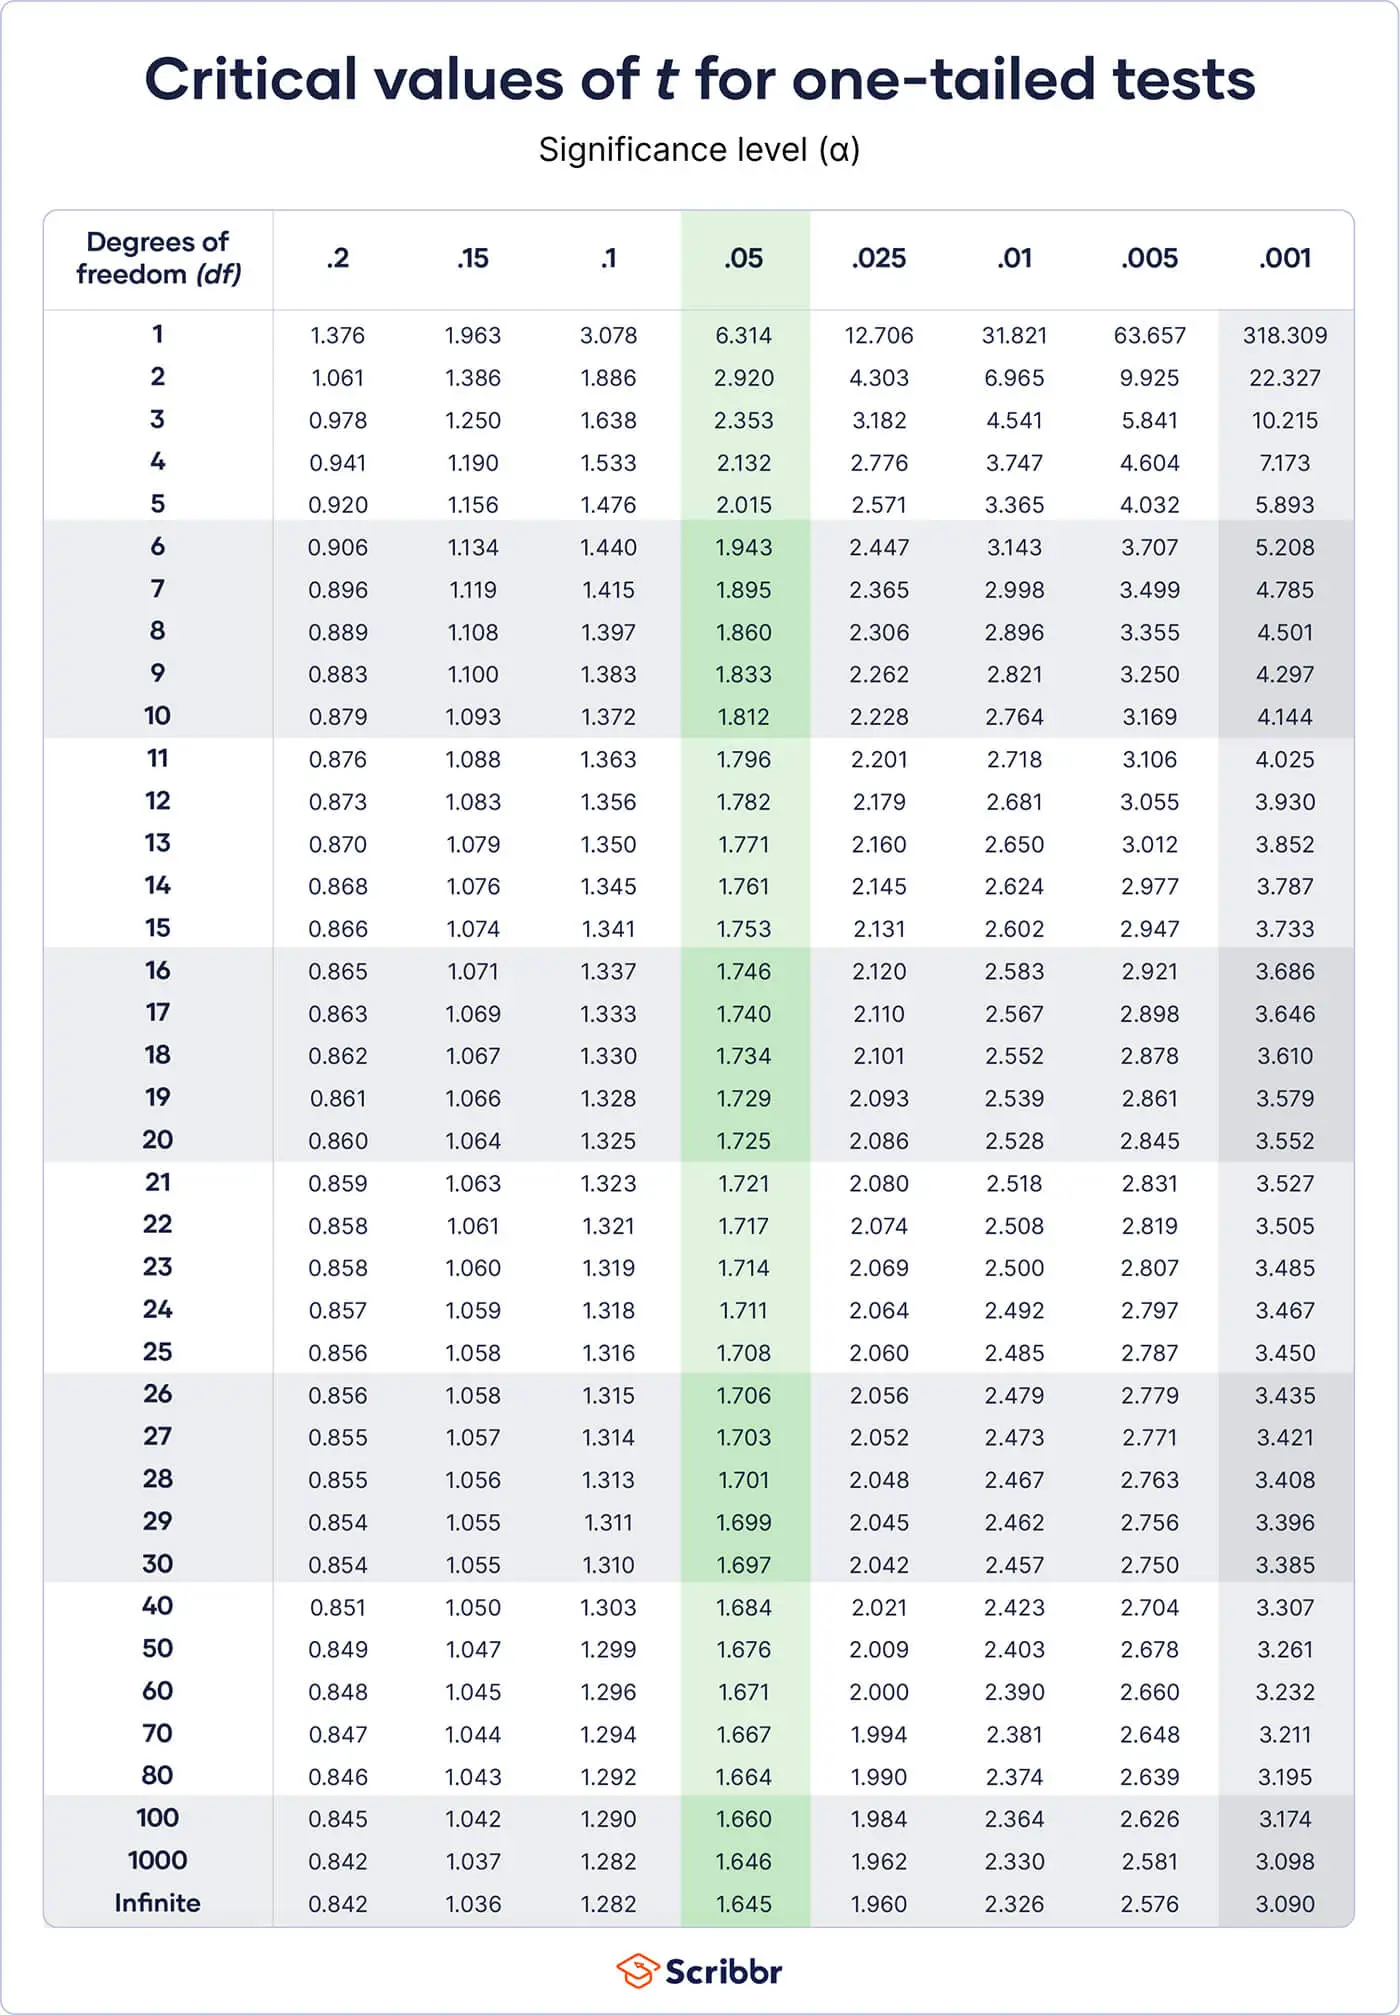
- Critical values of t for one-tailed tests
- Step-by-step guide to using the table

How to use the t table
If you need to find a critical value of t to perform a statistical test or calculate a confidence interval, follow this step-by-step guide.
To discover whether the acne cream is effective, you decide to compare the mean number of pimples on participants in the treatment and control groups using an independent samples t test.
- Null hypothesis: The treatment group and control group participants have the same mean number of pimples.
- Alternative hypothesis: The treatment group and control group participants differ in their mean numbers of pimples.
You calculate the t value for the sample. To know whether to reject the null hypothesis, you need to compare this t value to the critical value of t.
Step 1: Choose two-tailed or one-tailed
Two-tailed tests are used when the alternative hypothesis is non-directional.
- A non-directional hypothesis states that a population parameter (such as a mean or regression coefficient) is not equal to a certain value (such as 0). Two-tailed tests are appropriate for most studies.
- If you’re calculating a confidence interval, choose two-tailed.
One-tailed tests are used when the alternative hypothesis is directional.
- A directional hypothesis states that a population parameter is greater than or less than a certain value.
- Your alternative hypothesis is directional if it includes words such as “greater than,” “less than,” “increases,” “decreases,” or the “<” or “>” sign. If it doesn’t include these (or similar), it is probably non-directional.
- Alternative hypothesis: The treatment group and control group participants differ in their mean numbers of pimples.
This alternative hypothesis is non-directional. It doesn’t state whether the mean of the treatment group is greater or less than the mean of the control group, just that the means differ.
Since the alternative hypothesis is non-directional, it should be tested with a two-tailed test.
Step 2: Calculate the degrees of freedom
The degrees of freedom (df) of a statistic are calculated from the sample size (n). The equation you need to use depends on what type of test or procedure you’re performing.
| Test or procedure | Degrees of freedom (df) equation |
|---|---|
|
df = n – 1 |
|
df = n1 + n2 – 2
Where n1 is the sample size of group 1 and n2 is the sample size of group 2 |
|
df = n – 1
Where n is the number of pairs |
|
df = n – 2 |
df = n1 + n2 – 2
If you conducted an experimental trial with 14 participants in the placebo group and 17 participants in the treatment group, then
df = 14 + 17 – 2
df = 29
Step 3: Choose a significance level
By convention, the significance level (α) is almost always .05. The α = .05 column is highlighted in the table since it is the most commonly used significance level.
In certain situations, you may want to decrease your risk of Type I error by decreasing α, or decrease your risk of Type II error by increasing α.
If you’re calculating a confidence interval, choose the significance level based on your desired confidence level:
α = 1 – confidence level
The most common confidence level is 95% (or .95, when expressed as a proportion), corresponding to α = .05.
Step 4: Find the critical value of t in the t table
Now that you know whether your test is two-tailed or one-tailed, the degrees of freedom (df), and the significance level, you have all the information you need to use the t table.
- If the test is two-tailed or if you’re calculating a confidence interval, use the first table. If the test is one-tailed, use the second table.
- The degrees of freedom (df) are listed along the left side of the table. Find the table row for the df you calculated in Step 2. If you need a df that isn’t listed, then round down to the next smallest number (e.g., use df = 40 instead of df = 46).
- The significance levels are listed along the top of the table. Find the column for the significance level that you chose in Step 3. In most cases, you will use the highlighted column (α = .05).
- The critical value of t for your test is found where the row and column meet.
You can now compare this critical value of t to the t that you calculated for your sample. This comparison will allow you to decide whether to reject the null hypothesis.

Practice questions
Frequently asked questions about Student's t table
- How do I find the critical value of t in R?
-
You can use the qt() function to find the critical value of t in R. The function gives the critical value of t for the one-tailed test. If you want the critical value of t for a two-tailed test, divide the significance level by two.
Example: Calculating the critical value of t in R To calculate the critical value of t for a two-tailed test with df = 29 and α = .05:qt(p = .025, df = 29)
- How do I find the critical value of t in Excel?
-
You can use the T.INV() function to find the critical value of t for one-tailed tests in Excel, and you can use the T.INV.2T() function for two-tailed tests.
Example: Calculating the critical value of t in Excel To calculate the critical value of t for a two-tailed test with df = 29 and α = .05, click any blank cell and type:=T.INV.2T(0.05,29)
- How do I test a hypothesis using the critical value of t?
-
To test a hypothesis using the critical value of t, follow these four steps:
- Calculate the t value for your sample.
- Find the critical value of t in the t table.
- Determine if the (absolute) t value is greater than the critical value of t.
- Reject the null hypothesis if the sample’s t value is greater than the critical value of t. Otherwise, don’t reject the null hypothesis.
- How do I calculate a confidence interval of a mean using the critical value of t?
-
To calculate a confidence interval of a mean using the critical value of t, follow these four steps:
- Choose the significance level based on your desired confidence level. The most common confidence level is 95%, which corresponds to α = .05 in the two-tailed t table.
- Find the critical value of t in the two-tailed t table.
- Multiply the critical value of t by s/√n.
- Add this value to the mean to calculate the upper limit of the confidence interval, and subtract this value from the mean to calculate the lower limit.
- Why is the t distribution also called Student’s t distribution?
-
The t distribution was first described by statistician William Sealy Gosset under the pseudonym “Student.”
Sources in this article
We strongly encourage students to use sources in their work. You can cite our article (APA Style) or take a deep dive into the articles below.
This Scribbr articleTurney, S. (October 17, 2022). Student's t Table (Free Download) | Guide & Examples. Scribbr. Retrieved October 17, 2022, from https://www.scribbr.com/statistics/students-t-table/