What Is Standard Error? | How to Calculate (Guide with Examples)
The standard error of the mean, or simply standard error, indicates how different the population mean is likely to be from a sample mean. It tells you how much the sample mean would vary if you were to repeat a study using new samples from within a single population.
The standard error of the mean (SE or SEM) is the most commonly reported type of standard error. But you can also find the standard error for other statistics, like medians or proportions. The standard error is a common measure of sampling error—the difference between a population parameter and a sample statistic.
Why standard error matters
In statistics, data from samples is used to understand larger populations. Standard error matters because it helps you estimate how well your sample data represents the whole population.
With probability sampling, where elements of a sample are randomly selected, you can collect data that is likely to be representative of the population. However, even with probability samples, some sampling error will remain. That’s because a sample will never perfectly match the population it comes from in terms of measures like means and standard deviations.
By calculating standard error, you can estimate how representative your sample is of your population and make valid conclusions.
A high standard error shows that sample means are widely spread around the population mean—your sample may not closely represent your population. A low standard error shows that sample means are closely distributed around the population mean—your sample is representative of your population.
You can decrease standard error by increasing sample size. Using a large, random sample is the best way to minimize sampling bias.
Standard error vs standard deviation
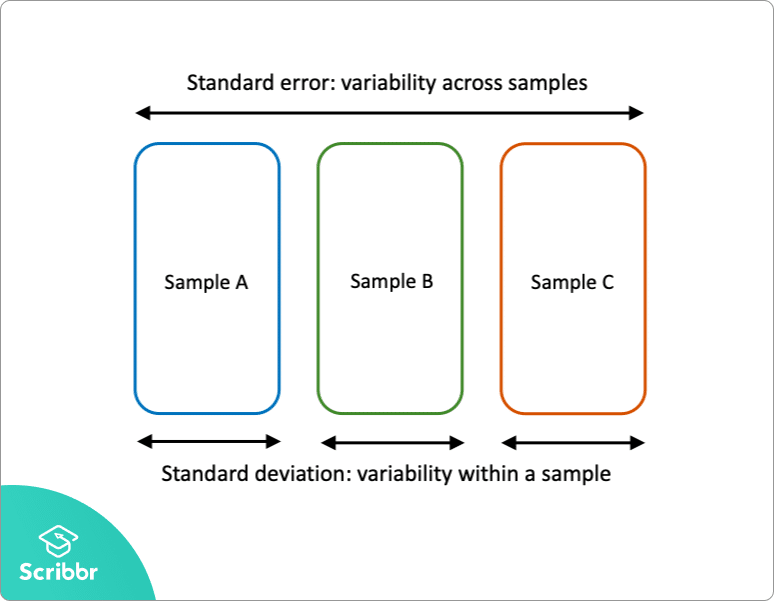
Standard error and standard deviation are both measures of variability:
- The standard deviation describes variability within a single sample.
- The standard error estimates the variability across multiple samples of a population.
The standard deviation is a descriptive statistic that can be calculated from sample data. In contrast, the standard error is an inferential statistic that can only be estimated (unless the real population parameter is known).
The standard deviation of the math scores is 180. This number reflects on average how much each score differs from the sample mean score of 550.
The standard error of the math scores, on the other hand, tells you how much the sample mean score of 550 differs from other sample mean scores, in samples of equal size, in the population of all test takers in the region.
Here's why students love Scribbr's proofreading services
Standard error formula
The standard error of the mean is calculated using the standard deviation and the sample size.
From the formula, you’ll see that the sample size is inversely proportional to the standard error. This means that the larger the sample, the smaller the standard error, because the sample statistic will be closer to approaching the population parameter.
Different formulas are used depending on whether the population standard deviation is known. These formulas work for samples with more than 20 elements (n > 20).
When population parameters are known
When the population standard deviation is known, you can use it in the below formula to calculate standard error precisely.
| Formula | Explanation |
|---|---|
 |
|
 is standard error
 is population standard deviation
 is the number of elements in the sample
When population parameters are unknown
When the population standard deviation is unknown, you can use the below formula to only estimate standard error. This formula takes the sample standard deviation as a point estimate for the population standard deviation.
| Formula | Explanation |
|---|---|
 |
|
 is sample standard deviation
First, find the square root of your sample size (n).
| Formula | Calculation |
|---|---|
 |

|

Next, divide the sample standard deviation by the number you found in step one.
| Formula | Calculation |
|---|---|
|

|


The standard error of math SAT scores is 12.8.
How should you report the standard error?
You can report the standard error alongside the mean or in a confidence interval to communicate the uncertainty around the mean.
The best way to report the standard error is in a confidence interval because readers won’t have to do any additional math to come up with a meaningful interval.
A confidence interval is a range of values where an unknown population parameter is expected to lie most of the time, if you were to repeat your study with new random samples.
With a 95% confidence level, 95% of all sample means will be expected to lie within a confidence interval of ± 1.96 standard errors of the sample mean.
Based on random sampling, the true population parameter is also estimated to lie within this range with 95% confidence.
For a normally distributed characteristic, like SAT scores, 95% of all sample means fall within roughly 4 standard errors of the sample mean.
| Confidence interval formula | |
|---|---|
|
CI = x̄ ± (1.96 × SE) x̄ = sample mean = 550 |
|
| Lower limit | Upper limit |
|
x̄ − (1.96 × SE) 550 − (1.96 × 12.8) = 525 |
x̄ + (1.96 × SE) 550 + (1.96 × 12.8) = 575 |
With random sampling, a 95% CI [525 575] tells you that there is a 0.95 probability that the population mean math SAT score is between 525 and 575.
Other standard errors
Aside from the standard error of the mean (and other statistics), there are two other standard errors you might come across: the standard error of the estimate and the standard error of measurement.
The standard error of the estimate is related to regression analysis. This reflects the variability around the estimated regression line and the accuracy of the regression model. Using the standard error of the estimate, you can construct a confidence interval for the true regression coefficient.
The standard error of measurement is about the reliability of a measure. It indicates how variable the measurement error of a test is, and it’s often reported in standardized testing. The standard error of measurement can be used to create a confidence interval for the true score of an element or an individual.
Frequently asked questions about standard error
- What is standard error?
-
The standard error of the mean, or simply standard error, indicates how different the population mean is likely to be from a sample mean. It tells you how much the sample mean would vary if you were to repeat a study using new samples from within a single population.
- What’s the difference between standard error and standard deviation?
-
Standard error and standard deviation are both measures of variability. The standard deviation reflects variability within a sample, while the standard error estimates the variability across samples of a population.
- What’s the difference between a point estimate and an interval estimate?
-
Using descriptive and inferential statistics, you can make two types of estimates about the population: point estimates and interval estimates.
- A point estimate is a single value estimate of a parameter. For instance, a sample mean is a point estimate of a population mean.
- An interval estimate gives you a range of values where the parameter is expected to lie. A confidence interval is the most common type of interval estimate.
Both types of estimates are important for gathering a clear idea of where a parameter is likely to lie.
Sources in this article
We strongly encourage students to use sources in their work. You can cite our article (APA Style) or take a deep dive into the articles below.
This Scribbr articleBhandari, P. (July 6, 2022). What Is Standard Error? | How to Calculate (Guide with Examples). Scribbr. Retrieved October 19, 2022, from https://www.scribbr.com/statistics/standard-error/