Variability | Calculating Range, IQR, Variance, Standard Deviation
Variability describes how far apart data points lie from each other and from the center of a distribution. Along with measures of central tendency, measures of variability give you descriptive statistics that summarize your data.
Variability is also referred to as spread, scatter or dispersion. It is most commonly measured with the following:
- Range: the difference between the highest and lowest values
- Interquartile range: the range of the middle half of a distribution
- Standard deviation: average distance from the mean
- Variance: average of squared distances from the mean
Why does variability matter?
While the central tendency, or average, tells you where most of your points lie, variability summarizes how far apart they are. This is important because the amount of variability determines how well you can generalize results from the sample to your population.
Low variability is ideal because it means that you can better predict information about the population based on sample data. High variability means that the values are less consistent, so it’s harder to make predictions.
Data sets can have the same central tendency but different levels of variability or vice versa. If you know only the central tendency or the variability, you can’t say anything about the other aspect. Both of them together give you a complete picture of your data.
Using simple random samples, you collect data from 3 groups:
- Sample A: high school students,
- Sample B: college students,
- Sample C: adult full-time employees.
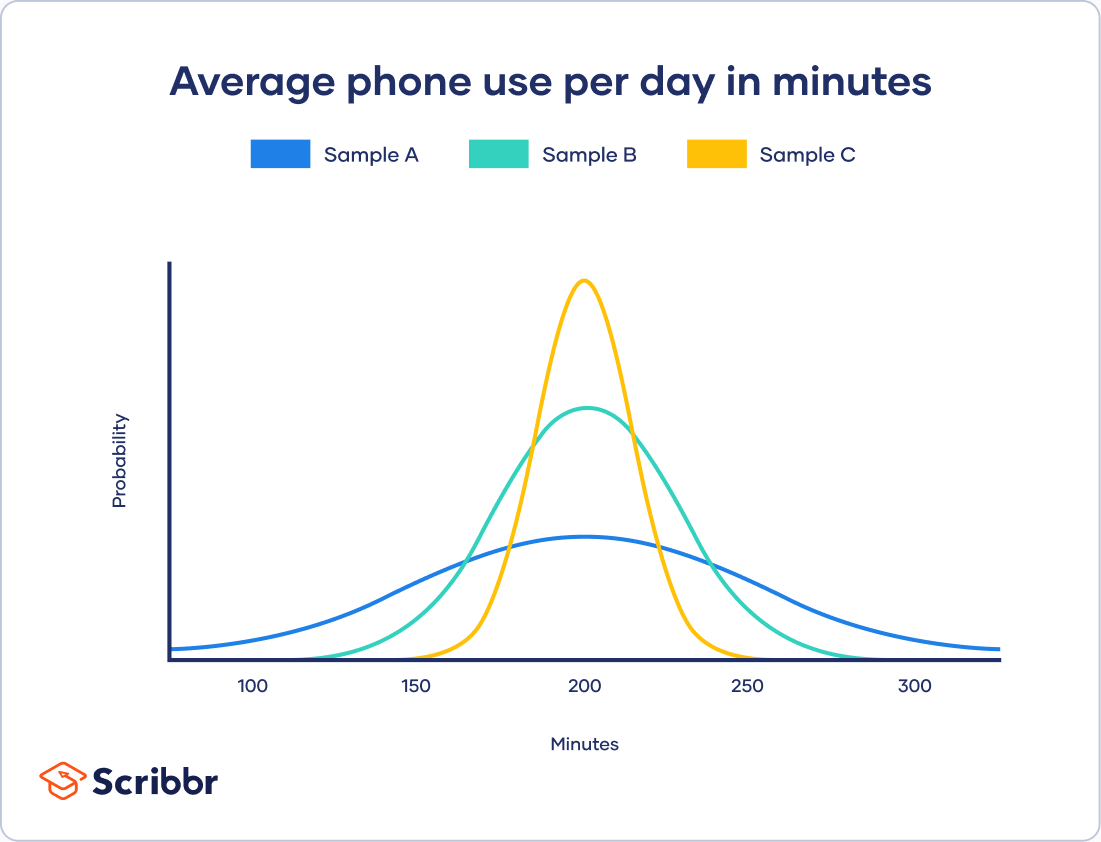
All three of your samples have the same average phone use, at 195 minutes or 3 hours and 15 minutes. This is the x-axis value where the peak of the curves are.
Although the data follows a normal distribution, each sample has different spreads. Sample A has the largest variability while Sample C has the smallest variability.
Range
The range tells you the spread of your data from the lowest to the highest value in the distribution. It’s the easiest measure of variability to calculate.
To find the range, simply subtract the lowest value from the highest value in the data set.
| Data (minutes) | 72 | 110 | 134 | 190 | 238 | 287 | 305 | 324 |
|---|
The highest value (H) is 324 and the lowest (L) is 72.
R = H – L
R = 324 – 72 = 252
The range of your data is 252 minutes.
Because only 2 numbers are used, the range is influenced by outliers and doesn’t give you any information about the distribution of values. It’s best used in combination with other measures.
Interquartile range
The interquartile range gives you the spread of the middle of your distribution.
For any distribution that’s ordered from low to high, the interquartile range contains half of the values. While the first quartile (Q1) contains the first 25% of values, the fourth quartile (Q4) contains the last 25% of values.

The interquartile range is the third quartile (Q3) minus the first quartile (Q1). This gives us the range of the middle half of a data set.
Multiply the number of values in the data set (8) by 0.25 for the 25th percentile (Q1) and by 0.75 for the 75th percentile (Q3).
Q1 position: 0.25 x 8 = 2
Q3 position: 0.75 x 8 = 6
Q1 is the value in the 2nd position, which is 110. Q3 is the value in the 6th position, which is 287.
IQR = Q3 – Q1
IQR = 287 – 110 = 177
The interquartile range of your data is 177 minutes.
Just like the range, the interquartile range uses only 2 values in its calculation. But the IQR is less affected by outliers: the 2 values come from the middle half of the data set, so they are unlikely to be extreme scores.
The IQR gives a consistent measure of variability for skewed as well as normal distributions.
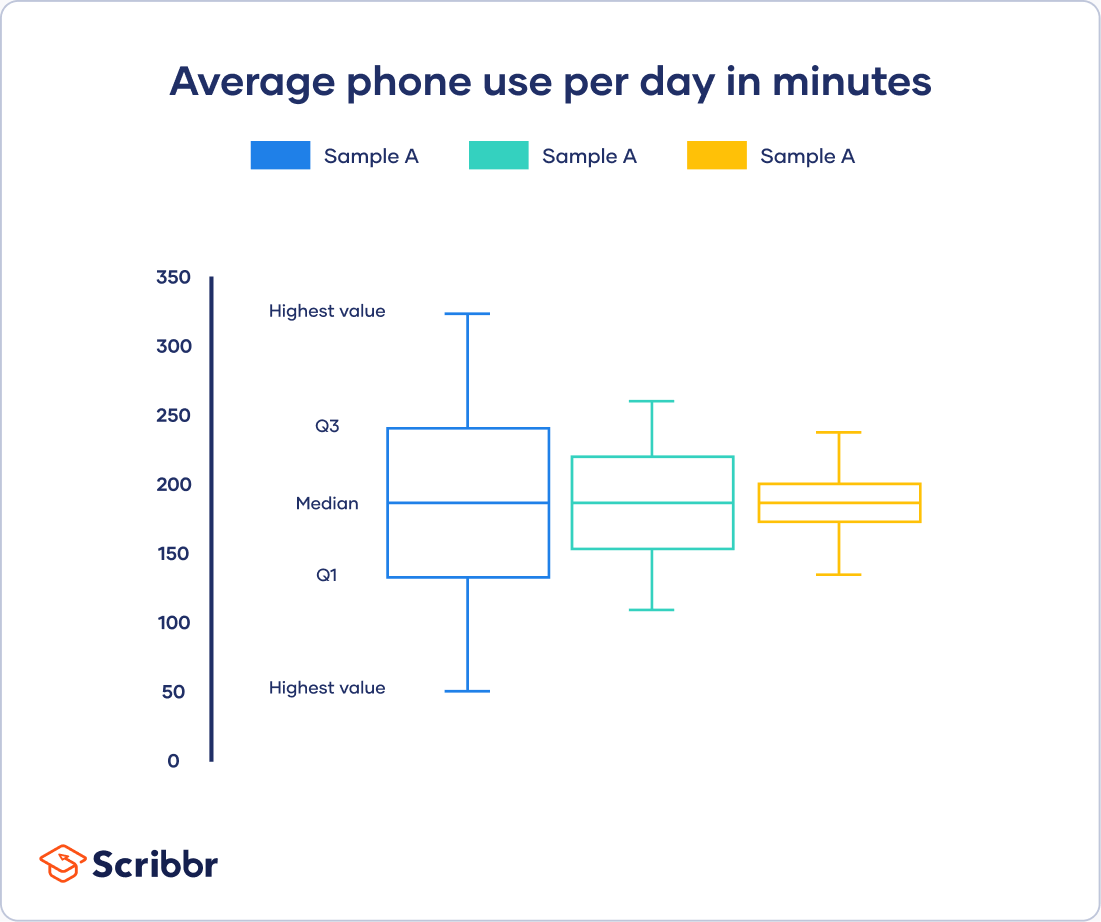
Five-number summary
Every distribution can be organized using a five-number summary:
- Lowest value
- Q1: 25th percentile
- Q2: the median
- Q3: 75th percentile
- Highest value (Q4)
These five-number summaries can be easily visualized using box and whisker plots.
Standard deviation
The standard deviation is the average amount of variability in your dataset.
It tells you, on average, how far each score lies from the mean. The larger the standard deviation, the more variable the data set is.
There are six steps for finding the standard deviation by hand:
- List each score and find their mean.
- Subtract the mean from each score to get the deviation from the mean.
- Square each of these deviations.
- Add up all of the squared deviations.
- Divide the sum of the squared deviations by n – 1 (for a sample) or N (for a population).
- Find the square root of the number you found.
| Step 1: Data (minutes) | Step 2: Deviation from mean | Steps 3 + 4: Squared deviation |
|---|---|---|
| 72 | 72 – 207.5 = -135.5 | 18360.25 |
| 110 | 110 – 207.5 = -97.5 | 9506.25 |
| 134 | 134 – 207.5 = -73.5 | 5402.25 |
| 190 | 190 – 207.5 = -17.5 | 306.25 |
| 238 | 238 – 207.5 = 30.5 | 930.25 |
| 287 | 287 – 207.5 = 79.5 | 6320.25 |
| 305 | 305 – 207.5 = 97.5 | 9506.25 |
| 324 | 324 – 207.5 = 116.5 | 13572.25 |
| Mean = 207.5 | Sum = 0 | Sum of squares = 63904 |
n – 1 = 7
63904 / 7 = 9129.14
s = √9129.14 = 95.54
The standard deviation of your data is 95.54. This means that on average, each score deviates from the mean by 95.54 points.
Standard deviation formula for populations
If you have data from the entire population, use the population standard deviation formula:
| Formula | Explanation |
|---|---|
 |
|
 = population standard deviation
 = sum of…
 = each value
 = population mean
 = number of values in the population
Standard deviation formula for samples
If you have data from a sample, use the sample standard deviation formula:
| Formula | Explanation |
|---|---|
 |
|
 = sample standard deviation
 = sample mean
 = number of values in the sample
Why use n – 1 for sample standard deviation?
Samples are used to make statistical inferences about the population that they came from.
When you have population data, you can get an exact value for population standard deviation. Since you collect data from every population member, the standard deviation reflects the precise amount of variability in your distribution, the population.
But when you use sample data, your sample standard deviation is always used as an estimate of the population standard deviation. Using n in this formula tends to give you a biased estimate that consistently underestimates variability.
Reducing the sample n to n – 1 makes the standard deviation artificially large, giving you a conservative estimate of variability.
While this is not an unbiased estimate, it is a less biased estimate of standard deviation: it is better to overestimate rather than underestimate variability in samples.
The difference between biased and conservative estimates of standard deviation gets much smaller when you have a large sample size.
Variance
The variance is the average of squared deviations from the mean. A deviation from the mean is how far a score lies from the mean.
Variance is the square of the standard deviation. This means that the units of variance are much larger than those of a typical value of a data set.
While it’s harder to interpret the variance number intuitively, it’s important to calculate variance for comparing different data sets in statistical tests like ANOVAs.
Variance reflects the degree of spread in the data set. The more spread the data, the larger the variance is in relation to the mean.
s = 95.5
s2 = 95.5 x 95.5 = 9129.14
The variance of your data is 9129.14.
To find the variance by hand, perform all of the steps for standard deviation except for the final step.
Variance formula for populations
| Formula | Explanation |
|---|---|
 |
|
 = population variance
 = each value
 = number of values in the population
Variance formula for samples
| Formula | Explanation |
|---|---|
 |
|
 = sample variance
Biased versus unbiased estimates of variance
An unbiased estimate in statistics is one that doesn’t consistently give you either high values or low values – it has no systematic bias.
Just like for standard deviation, there are different formulas for population and sample variance. But while there is no unbiased estimate for standard deviation, there is one for sample variance.
If the sample variance formula used the sample n, the sample variance would be biased towards lower numbers than expected. Reducing the sample n to n – 1 makes the variance artificially larger.
In this case, bias is not only lowered but totally removed. The sample variance formula gives completely unbiased estimates of variance.
So why isn’t the sample standard deviation also an unbiased estimate?
That’s because sample standard deviation comes from finding the square root of sample variance. Since a square root isn’t a linear operation, like addition or subtraction, the unbiasedness of the sample variance formula isn’t carried over the sample standard deviation formula.
What’s the best measure of variability?
The best measure of variability depends on your level of measurement and distribution.
Level of measurement
For data measured at an ordinal level, the range and interquartile range are the only appropriate measures of variability.
For more complex interval and ratio levels, the standard deviation and variance are also applicable.
Distribution
For normal distributions, all measures can be used. The standard deviation and variance are preferred because they take your whole data set into account, but this also means that they are easily influenced by outliers.
For skewed distributions or data sets with outliers, the interquartile range is the best measure. It’s least affected by extreme values because it focuses on the spread in the middle of the data set.
Frequently asked questions about variability
- What is variability?
-
Variability tells you how far apart points lie from each other and from the center of a distribution or a data set.
Variability is also referred to as spread, scatter or dispersion.
- What are the 4 main measures of variability?
-
Variability is most commonly measured with the following descriptive statistics:
- Range: the difference between the highest and lowest values
- Interquartile range: the range of the middle half of a distribution
- Standard deviation: average distance from the mean
- Variance: average of squared distances from the mean
- What’s the difference between central tendency and variability?
-
While central tendency tells you where most of your data points lie, variability summarizes how far apart your points from each other.
Data sets can have the same central tendency but different levels of variability or vice versa. Together, they give you a complete picture of your data.
- What’s the difference between descriptive and inferential statistics?
-
Descriptive statistics summarize the characteristics of a data set. Inferential statistics allow you to test a hypothesis or assess whether your data is generalizable to the broader population.
Sources in this article
We strongly encourage students to use sources in their work. You can cite our article (APA Style) or take a deep dive into the articles below.
This Scribbr articleBhandari, P. (September 2, 2022). Variability | Calculating Range, IQR, Variance, Standard Deviation. Scribbr. Retrieved October 19, 2022, from https://www.scribbr.com/statistics/variability/